Visualize Device Data through Grafana Dashboards
Grafana is an open-source software for monitoring and analysis. One of its major characteristics is it supports many different data sources, from popular CloudWatch, Elasticsearch, Graphite, and influxDB, to OpenStack Gnocchi or Google Calendar. Its range is very extensive. However, for other data source require to implement SimpleJson to access your data. The DeviceOn native support SimpleJson APIs and data source plugin on Grafana. This lab guides you how to visualize device data via Grafana dashboard.
Prerequisite
A running DeviceOn server.
A running Grafana service with DeviceOn data source plugin.
A device which installed WISE-Agent, that connects to DeviceOn server.
Steps to Visualization
Step 1: Launch Grafana Web Service Shortcut on Desktop or access the Grafana service endpoint.

Step 2: Login to Grafana portal with your account, password (Default: admin/admin)
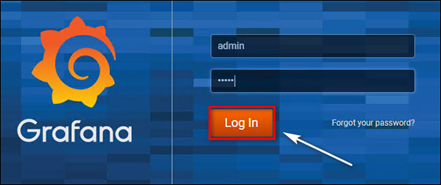
Step 3: Create a data source to access DeviceOn SimpleJson API.
Click on “Add data source” and select “DeviceOn-SimpleJson”, (for previous version might be RMM-SimpleJson)
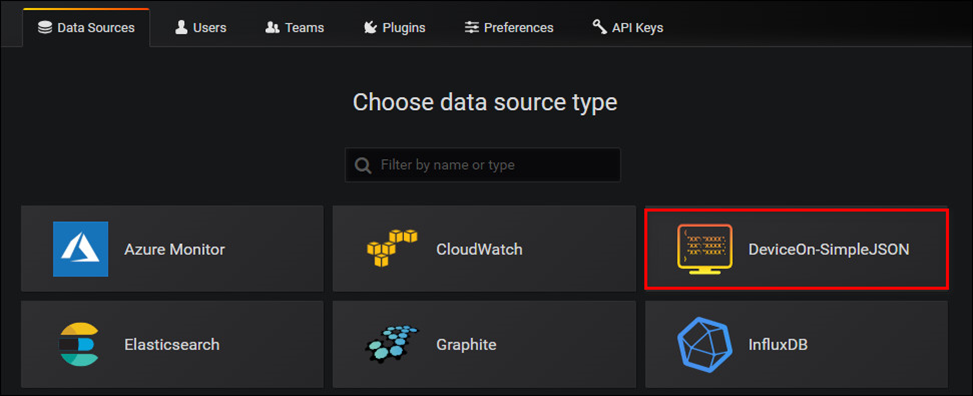
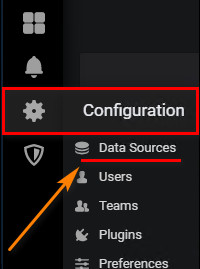

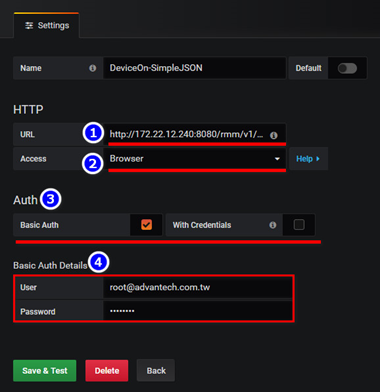
Step 4: Given below parameters for data source plugin to retrieve device data from DeviceOn APIs.
URL: http://<DEVICEON_SERVER>:8080/rmm/v1/grafana/simplejson
Access: Browser
Auth: Basic Auth (Support on perpetual version)
Basic Auth: DeviceOn Account & Password
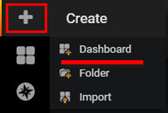
Step 5: Create a dashboard to visualize your device data.
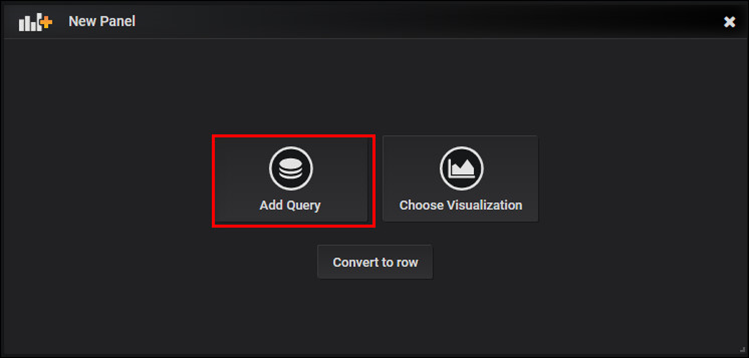
Select “Add Query” for your device.
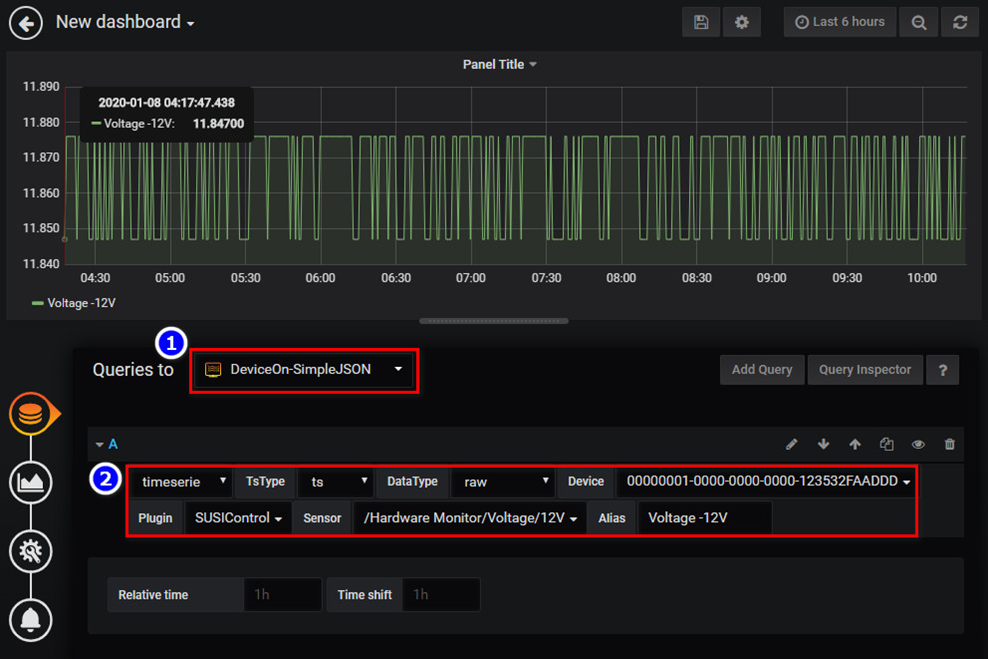
Select DeviceOn-SimpleJson from “Queries to”, and pick-up your device with AgentID, Plugin, Sensor and Alias Name (Option).
Last updated